I downloaded the Apple production, 2018 data from Our World in Data. I chose this data because my friend grew up on an apple farm and the data is very interesting to her.
This is the Link to the data.
The code chunk below will load the package I am using to read and prepare the data for analysis.
- Read the data in
- Use glimpse to see the names and types of the columns
glimpse(apple_production)Rows: 6,198 Columns: 4 $ Entity <chr> "Afghani… $ Code <chr> "AFG", "… $ Year <dbl> 1961, 19… $ `Crops - Apples - 515 - Production - 5510 - tonnes` <dbl> 15100, 1…# View(apple_production)- Use output from glimpse and view to prepare the data for analysis
Create the object
countriesthis will include the countries that I would like to compare in my dataset.Change the name of column 1 from entities to countries and column 4 to Tons.
Use filter to extract the rows I want to keep: year 2001
Select the columns to keep Countries, Years, and Tons
Assign the output to apple
Display the first 10 rows of apple
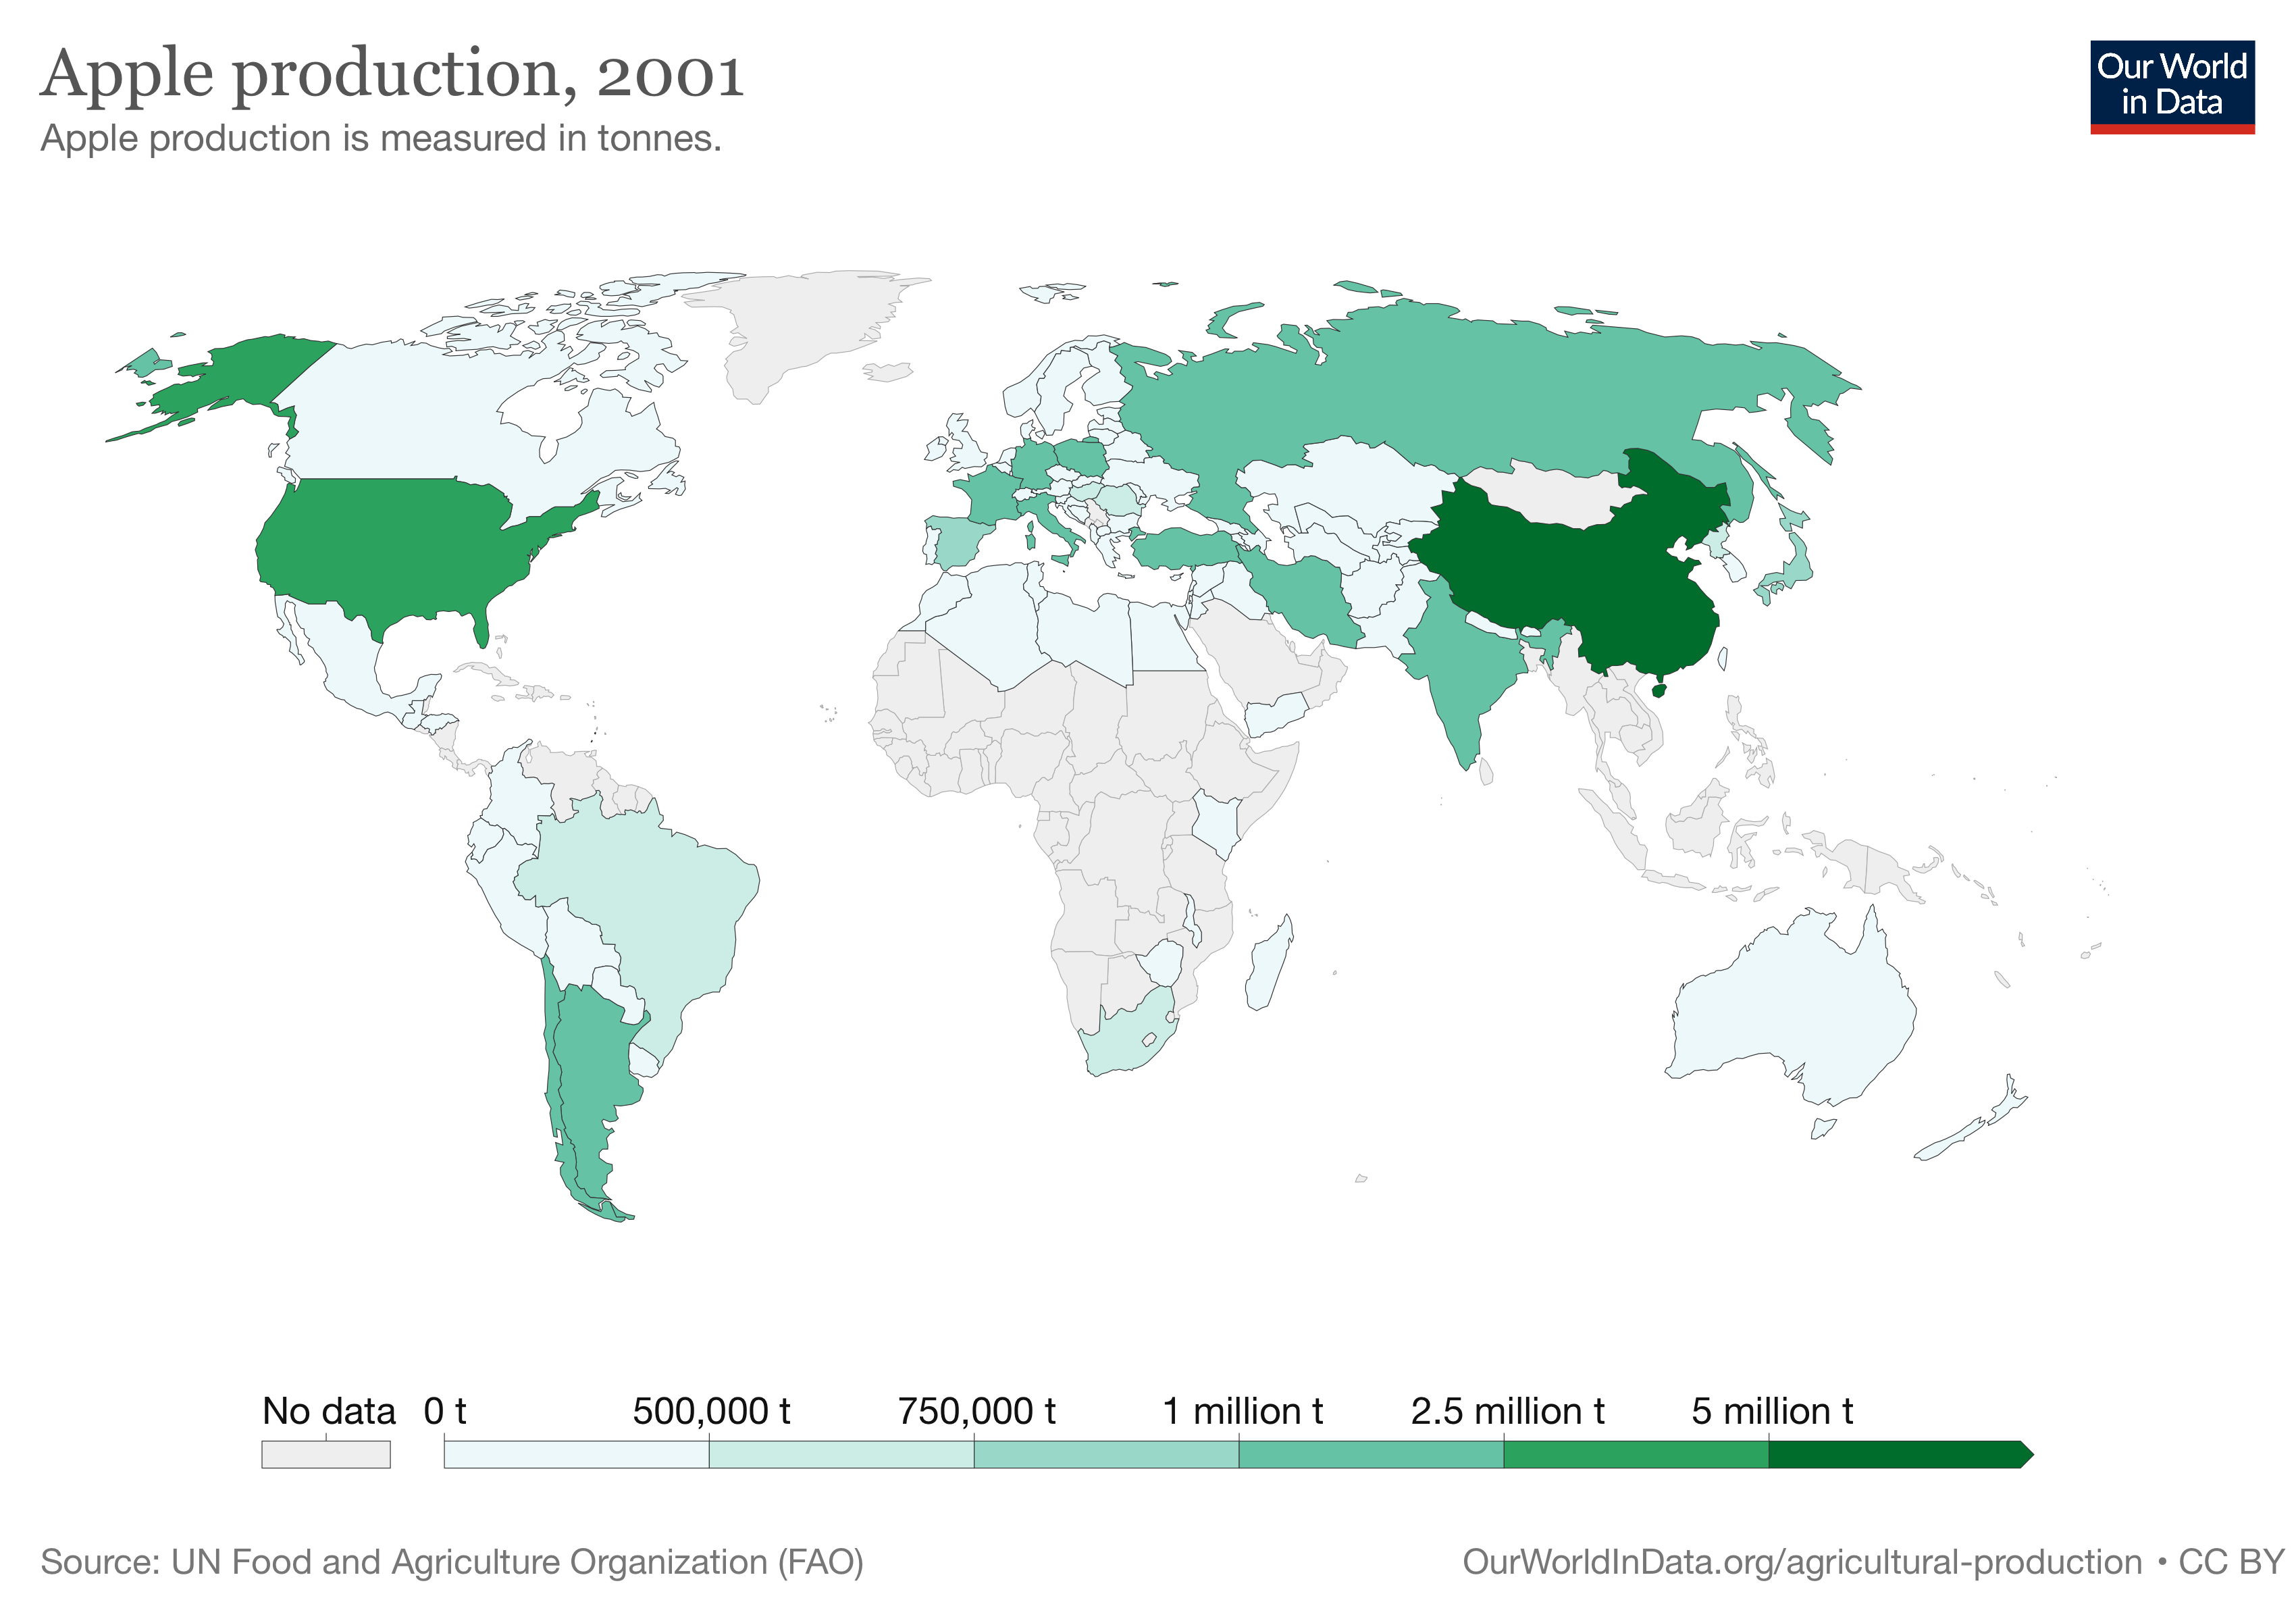
countries <- c("China",
                "European Union",
                "United States",
                "India",
                "Russia",
                "Brazil")

apple <- apple_production  %>%
  rename(Country = 1, Tons = 4)  %>%
  filter(Year >= 2001, Country %in% countries)  %>%
  select(Country, Year, Tons)

apple
# A tibble: 108 × 3 Country Year Tons <chr> <dbl> <dbl> 1 Brazil 2001 716030 2 Brazil 2002 857388 3 Brazil 2003 841821 4 Brazil 2004 980203 5 Brazil 2005 850535 6 Brazil 2006 863019 7 Brazil 2007 1115379 8 Brazil 2008 1124155 9 Brazil 2009 1222885 10 Brazil 2010 1279124 # … with 98 more rowsCheck to see if the total for 2001 equals the total in the graph
# A tibble: 6 × 3
  Country         Year     Tons
  <chr>          <dbl>    <dbl>
1 Brazil          2001   716030
2 China           2001 20022749
3 European Union  2001 12985775
4 India           2001  1230000
5 Russia          2001  1640000
6 United States   2001  4274201
Add a picture
write_csv(apple, file= "apple.csv")